
Table of contents
8 Healthcare Dashboard Examples (2026)

Written by
Blaze Team

Reviewed by
Nanxi Liu
Expert Verified
Most healthcare dashboards don’t show the right numbers, and this can affect decision-making quality. Seeing how other healthcare organizations structure their dashboards can help you determine which metrics deserve attention.
So, I pulled 8 healthcare dashboard examples from de-identified data, drawing on patterns I’ve used to help clients build systems to cover metrics like patient safety and compliance tracking.
You'll see what each dashboard type tracks, what it's built to help you catch early, and how to think through building your own. By the end, you’ll have a better idea about what kind of healthcare dashboards you can build for your organization.
What Is a Healthcare Dashboard?
A healthcare dashboard is a visual reporting tool that brings clinical, financial, business, or patient data into one view to support specific decisions. It draws data from clinical and operational systems to give your team a current picture of your organization’s performance and help you spot problems that require attention.
The data that your organization chooses to put on the dashboard depends on who uses it and what they need to manage. For example, a hospital operations manager might track bed occupancy, discharge delays, and staffing levels to identify where additional resources are needed.
What Should a Healthcare Dashboard Include?
A useful healthcare dashboard presents information that supports specific decisions and pinpoints problems. Here’s what you should consider including:
- Relevant KPIs: Key performance indicators are measurable results that help you make decisions and prioritize work. Consider tracking the readmission measure relevant to the care team.
- Trends and comparisons: Historical data shows how performance changes over time. Teams compare results to spot important trends. For instance, compare discharge times before and after introducing a new treatment routine.
- Filters: These data controls narrow search results to specific groups from summary metrics, helping your team drill down into specific numbers. An example is finding claim denials from summary data.
- Clear visual hierarchy: Healthcare dashboards allow you to prioritize the metrics that your team sees first. This function enables you to see critical results, such as overdue claims, immediately.
- Integrations with other software and apps: A dashboard can pull current data from other apps and show when the information was last updated. For example, an EHR data integration can help a dashboard display current bed occupancy and availability, giving hospital staff a quick view of capacity.
- Appropriate access: Role-based permissions determine which information each user sees and help protect sensitive records during routine work. Specifically, only authorized providers can view session metrics, such as changes in symptoms or patient-reported outcomes, in a mental health app dashboard.
8 Healthcare Dashboard Examples
→ 1. Hospital Operations Dashboard
→ 2. Patient Safety Dashboard
→ 3. Patient Experience Dashboard
→ 4. Population Health Dashboard
→ 5. Revenue Cycle Dashboard
→ 6. Provider Performance Dashboard
→ 7. Healthcare Executive Dashboard
→ 8. Compliance Dashboard
I pulled these 8 healthcare dashboard examples from cleansed, de-identified patient data. We’ve helped clients build similar dashboards for their organizations. These examples show what a healthcare dashboard can look like in practice:
1. Hospital Operations Dashboard
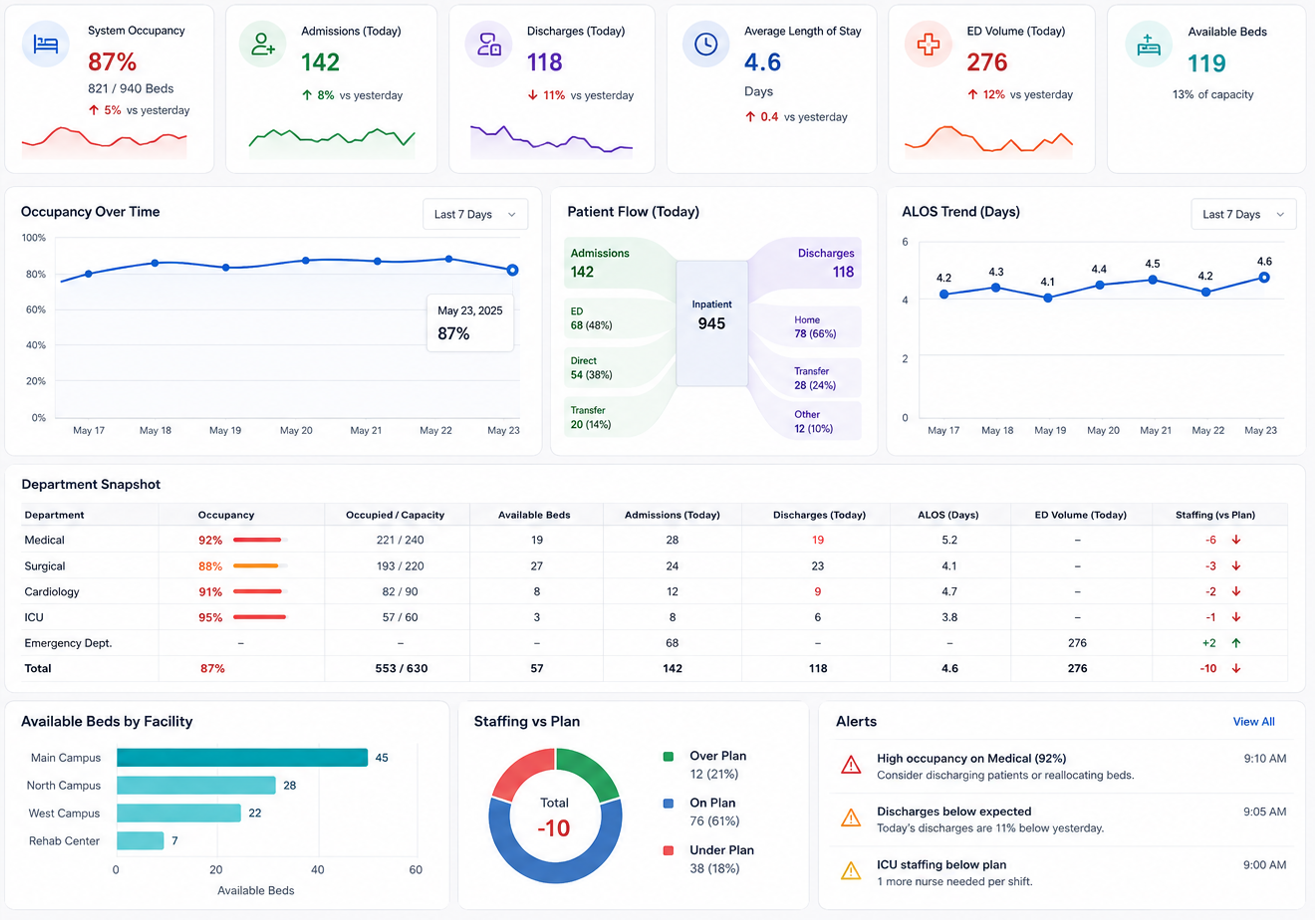
Tracks bed occupancy, admissions, discharges, and average length of stay. It can also display emergency department volume, available beds, and staffing levels. You can view trends, compare departments, or filter the data to see specific totals.
What It Helps You Identify
You can see where discharge delays accumulate, which units are nearing capacity, and where staffing gaps line up with rising patient volume.
2. Patient Safety Dashboard
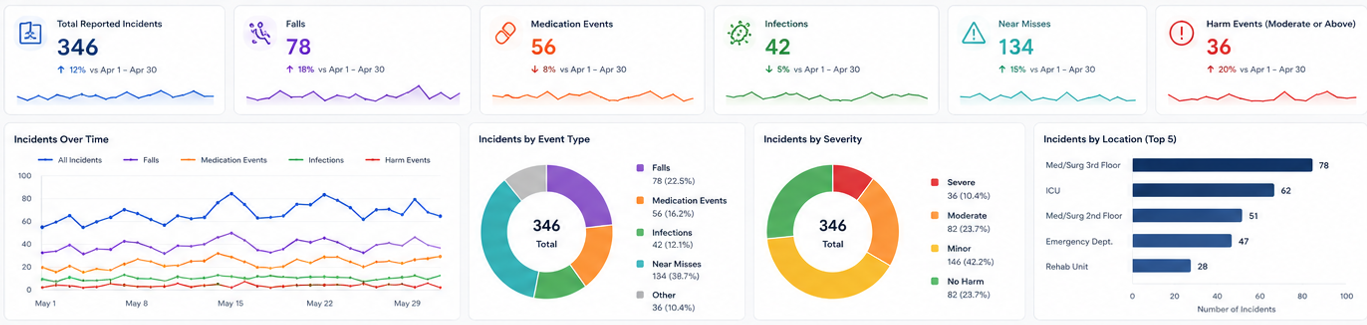
Patient safety dashboards report incidents such as medication events and harm severity. You can filter by facility, department, event type, severity, and reporting period.
What It Helps You Identify
By finding recurring problems that are distinct from isolated incidents, you can take measures to lower the overall risks and prevent further incidents from occurring.
3. Patient Experience Dashboard
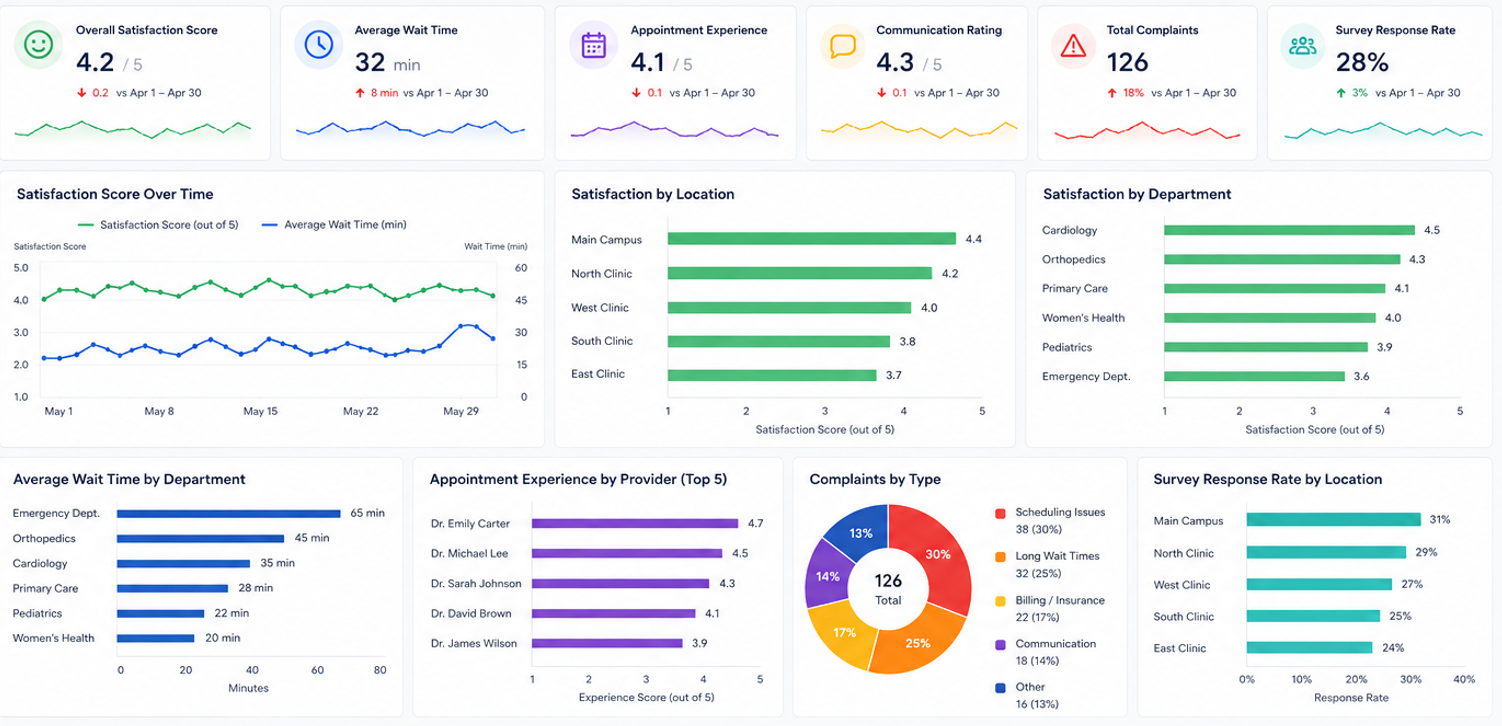
Patient experience dashboards give a 30,000-foot view of how patients are enjoying their experience. These dashboards show wait times, complaints, and survey results, which you can view by department, provider, or period.
What It Helps You Identify
You can find satisfaction drops that stem from measurable issues such as longer wait times or procedure methodologies. Then, you can spotlight which departments need improvement by drilling down into the precise reasons.
4. Population Health Dashboard
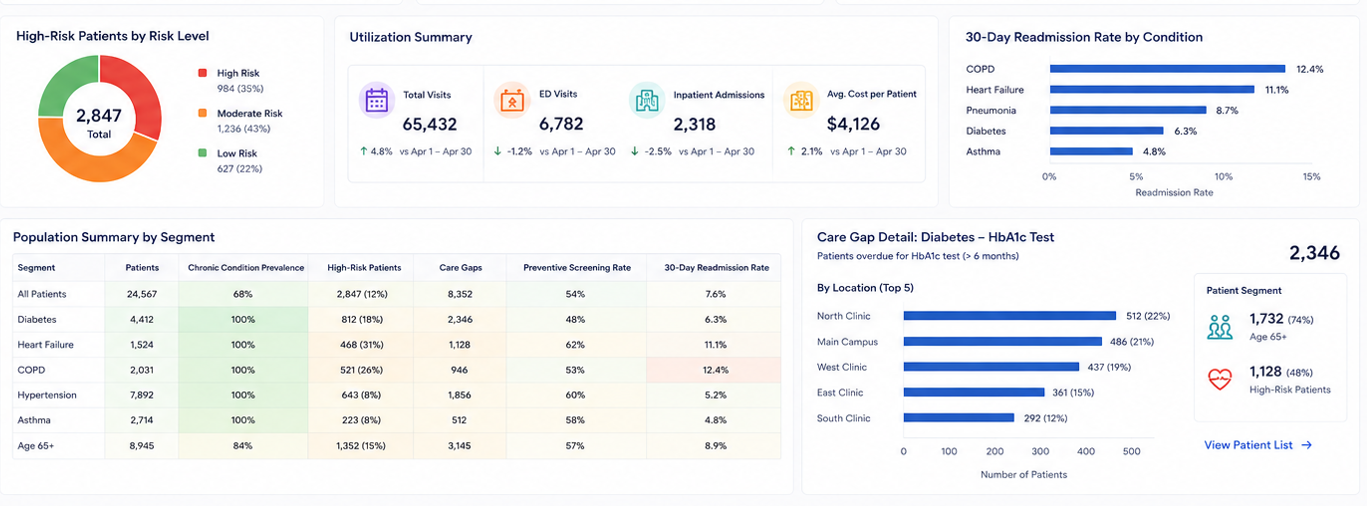
These dashboards visualize different patient types and conditions, from acute to chronic. You can find the overall number of high-risk patients and how many regular patients undergo preventive screening, segmented by clinical or demographic criteria.
What It Helps You Identify
Your teams can identify which patients need outreach first. You can also spot growing numbers of certain patient types, like those with chronic illness. Identifying these patients can help you plan staffing needs and hire more professionals as demand grows.
5. Revenue Cycle Dashboard
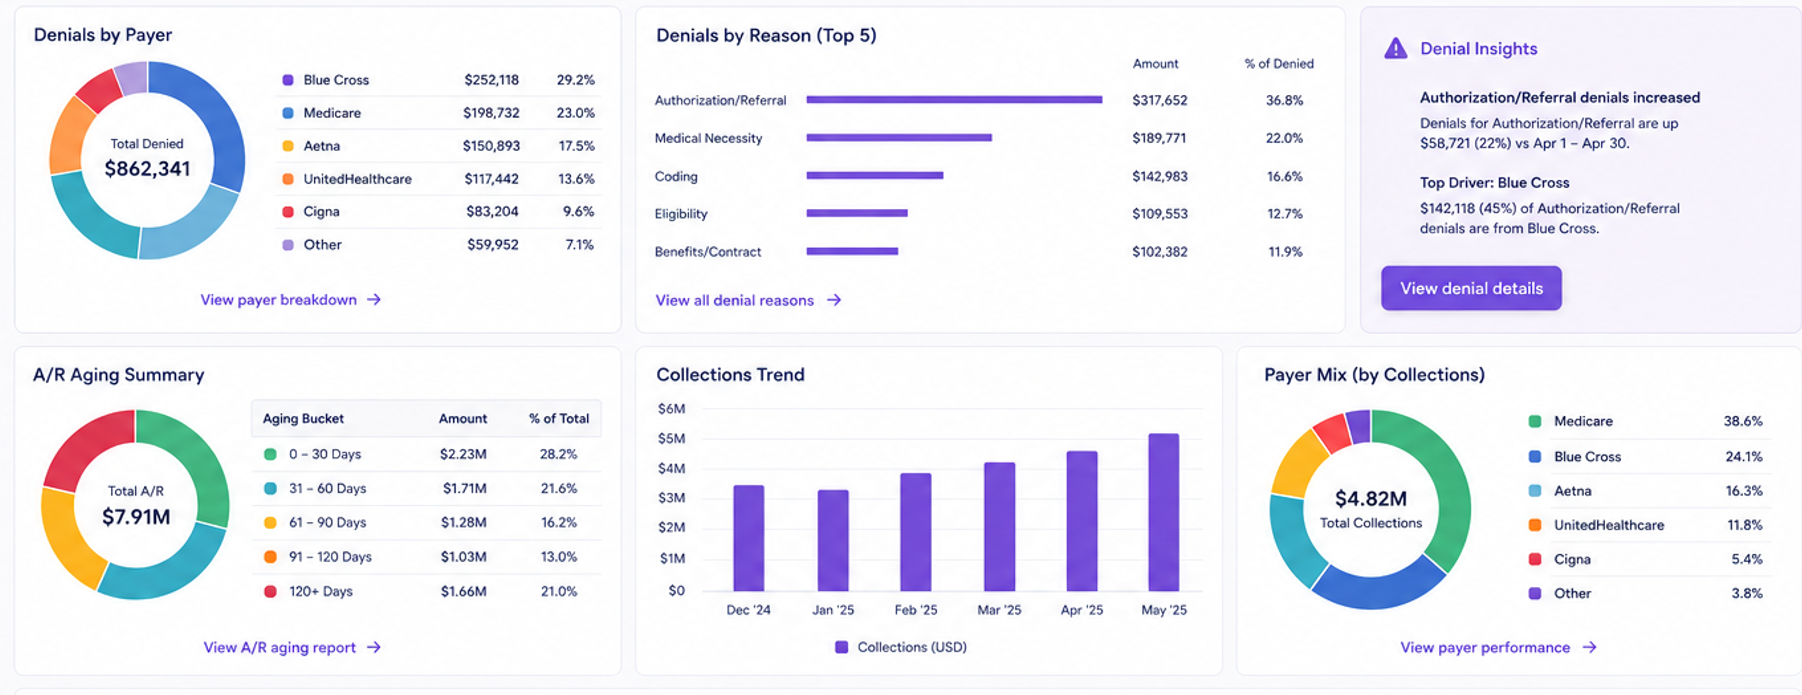
Track all parts of your revenue cycle with these dashboards. You can view submitted claims, denial and clean claim rates, days in A/R, and collections.
What It Helps You Identify
These dashboards help your team find the reasons for slow reimbursement and why denials are being backlogged. For instance, your billing manager can find that one payer accounts for a growing share of authorization denials and flag the pattern to the coding team before month-end.
6. Provider Performance Dashboard
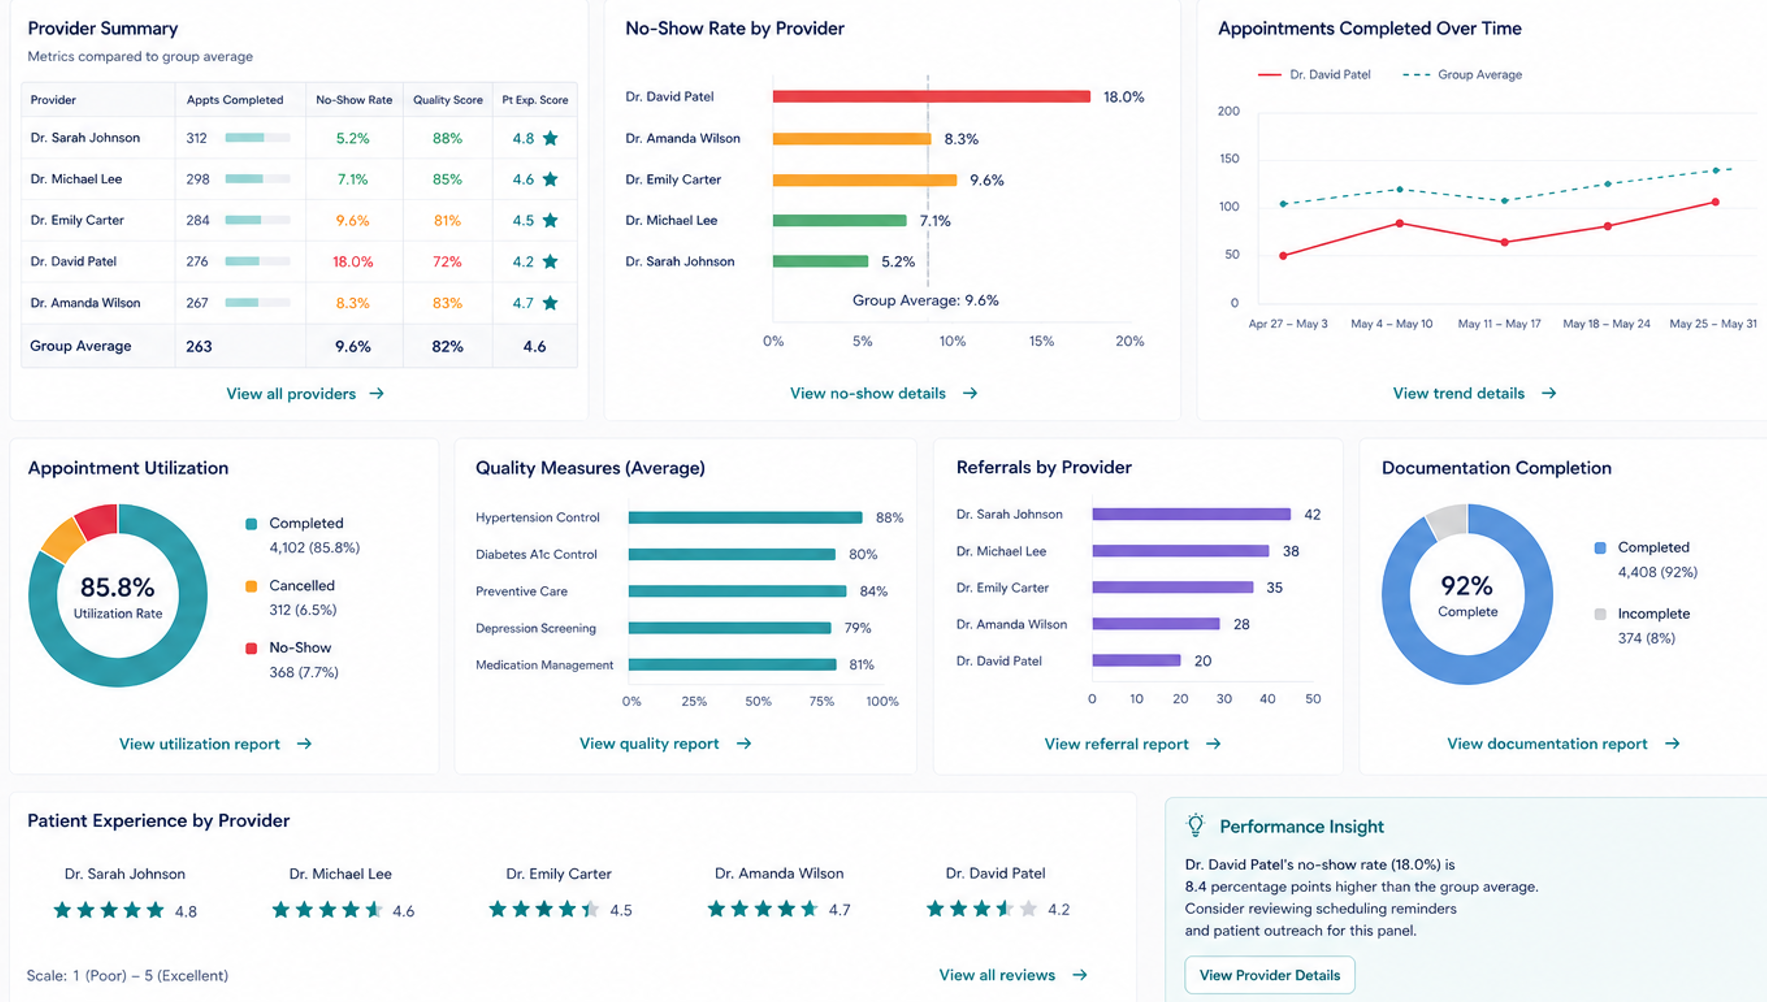
A provider performance dashboard lets management review performance at the provider or care-team level. You can track patient volume, quality measures, referrals, and other relevant measures to identify differences across providers or teams.
What It Helps You Identify
You can find patterns worth addressing, such as unusually high per-provider no-show rates, without reducing a provider's performance to a single productivity number.
7. Healthcare Executive Dashboard
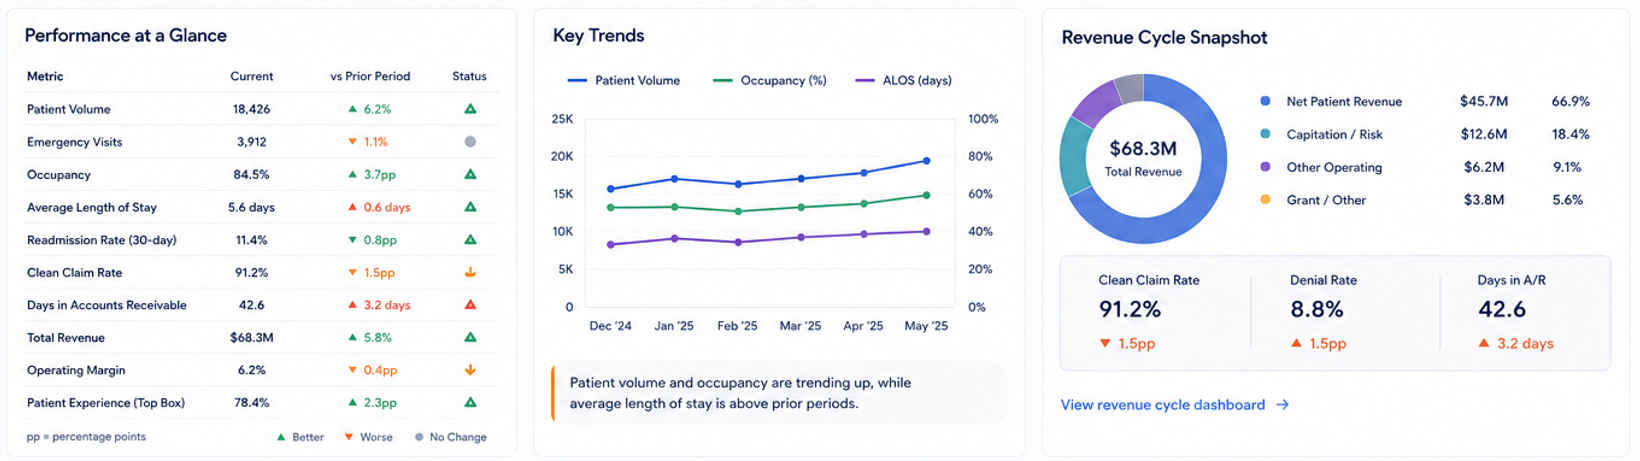
Healthcare executive dashboards help administrators track patient volume, occupancy, quality measures, and revenue. These metrics give executives a clear view of the clinic’s overall business performance.
What It Helps You Identify
This data helps you identify where performance problems may be developing and which areas need closer review. For instance, rising patient volume alongside longer stays and higher occupancy could signal discharge delays, prompting leadership to investigate patient flows and staffing.
8. Compliance Dashboards
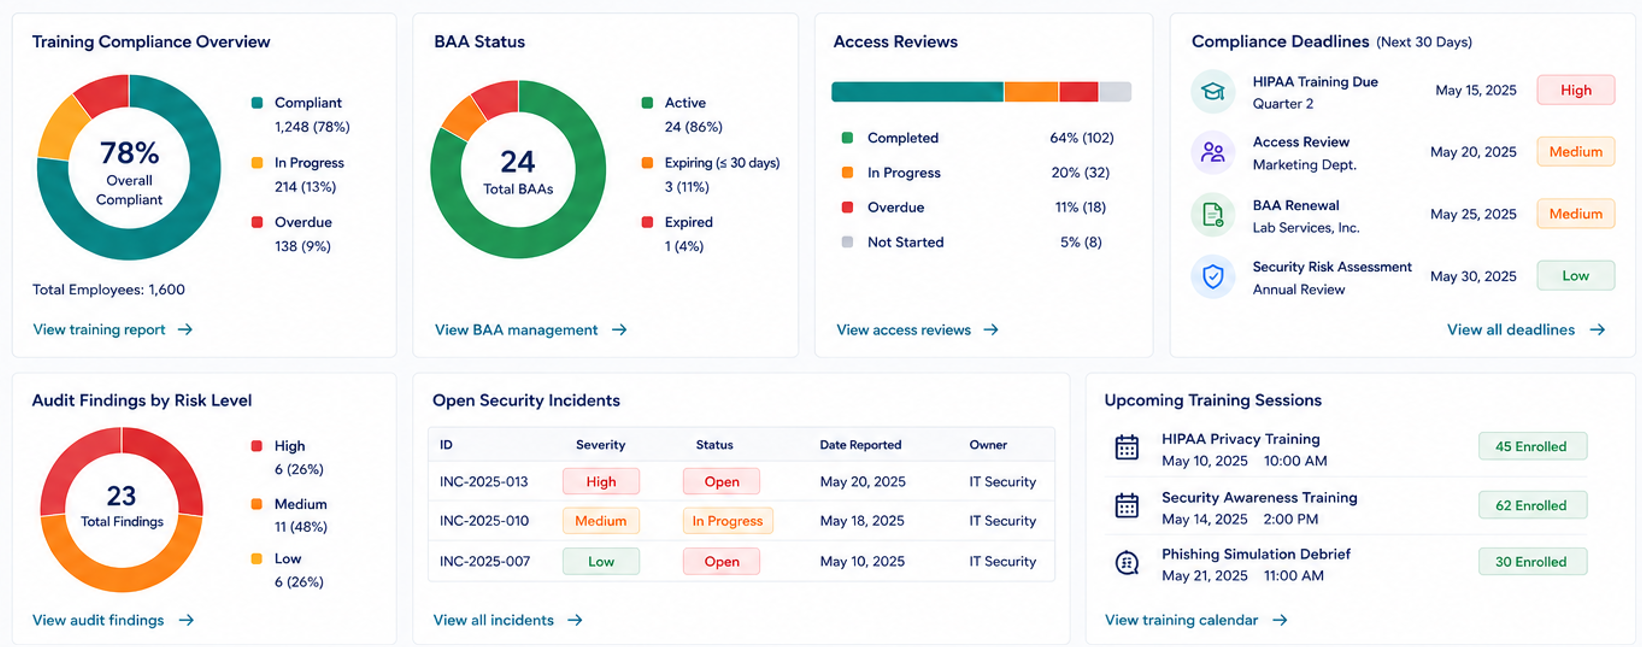
Compliance dashboards track HIPAA training, Business Associate Agreements (BAAs), access reviews, audit findings, security incidents, and deadlines for fixing compliance issues. They help compliance teams identify overdue requirements, unresolved findings, and other issues that need follow-up.
What It Helps You Identify
You can immediately find upcoming training sessions, incomplete reviews, and other compliance work requiring follow-up. In practice, your compliance manager can see that several employees have overdue HIPAA training and follow up before your internal completion deadline.
How to Build a Healthcare Dashboard
Build your healthcare dashboard by defining how it will support decision-making and then connecting it to relevant applications. Follow these 4 steps:
Step 1: Define the Decision the Dashboard Supports
Start by identifying the questions your team needs the dashboard to answer. A clear purpose helps you choose measures that support user responsibilities. When you’ve defined your decisions, select KPIs that directly support them. For example, a nurse monitoring bed capacity may need occupancy and discharge data to determine when capacity constraints require attention.
Step 2: Connect the Required Healthcare Data
Healthcare dashboards can draw data from EHRs, claims platforms, scheduling systems, and other relevant sources. These systems may use different formats, field names, and definitions.
Your team should map and standardize the required data, then set refresh schedules based on how frequently each source changes. This way, a dashboard can show when claims data was last updated so users know how current the information is.
Step 3: Choose KPIs and Visualizations
Select KPIs that support your dashboard’s purpose and visualizations that make those measures easy to interpret. For example, use a KPI card to show current occupancy at a glance, and a line chart to show how occupancy changes over time.
Your team needs to define each KPI the same way before comparing results across departments, facilities, or time periods. This means that if two departments use different time periods to calculate readmission rates, their results cannot be compared directly.
Step 4: Set Access and Test the Dashboard
Configure dashboard access around user roles, responsibilities, and applicable privacy and security requirements. HIPAA generally requires covered entities to make reasonable efforts to limit workforce access to PHI based on job responsibilities. However, the minimum necessary standard has specific exceptions.
You should also test calculations, filters, permissions, and data refreshes before relying on your dashboard. For instance, you might identify an incorrectly configured date filter during testing before staff begins using it for routine reporting.
Build Custom Healthcare Dashboards With Blaze.tech
If these healthcare dashboard examples inspire you to build your own customized versions, Blaze.tech can help you turn them into working software. Build healthcare dashboards around the KPIs, data sources, users, and unique workflows that actually matter to your team.
Here’s why more providers go with Blaze:
- Get healthcare software built for you: A dedicated three-person implementation team, including a project manager, healthcare developer, and integration engineer, builds production-ready healthcare dashboards and other apps to your requirements. Blaze’s Integrations team can also connect your EHR and other healthcare systems.
- Opt to self-build: Use Blaze’s visual builder to create custom healthcare dashboards and applications without technical expertise.
- Replace repetitive administrative work: Connect dashboards to workflows that automate patient intake, document routing, approvals, reminders, and other manual tasks without replacing your existing EHR.
- Faster implementation than traditional builds: Launch custom healthcare dashboards and applications in weeks rather than waiting months for a traditional development cycle.
- AI integrations built for real clinical workflows: Support automated patient intake, document extraction, OpenAI use cases, and secure EHR and EMR connections that feed data into your healthcare workflows.
- Built on compliance-ready infrastructure: Blaze is a HIPAA-enabling, HITRUST e1-certified, SOC 2 Type II healthcare app development platform for building applications that handle sensitive healthcare data.
Schedule a free build consultation call today and learn how you can move away from rigid, out-of-the-box healthcare dashboards and get a customized solution that actually helps you make decisions.
Frequently Asked Questions
Do You Need a HIPAA-Compliant Healthcare Dashboard?
If your dashboard creates, receives, maintains, or transmits protected health information (PHI) for a HIPAA-covered entity or business associate, it must be used in a way that complies with applicable HIPAA requirements. This includes appropriate safeguards, access controls, and other required protections for PHI.
HIPAA compliance applies to your organization’s use of the dashboard, not to the dashboard itself. Dashboards that use only properly de-identified data are generally not subject to the HIPAA Privacy Rule for that data.
Can You Build a Healthcare Dashboard in Excel?
Yes, you can build a healthcare dashboard in Excel. The app works for smaller healthcare dashboards, prototypes, and KPI tracking using tables, PivotTables, charts, and slicers. You can use qualifying Microsoft 365 services in HIPAA-regulated workflows under Microsoft’s applicable BAA, but compliance also depends on how PHI is stored, shared, accessed, and protected.
Where Can You Find Healthcare Datasets for Building Dashboards?
You can find healthcare datasets for building dashboards through the Centers for Medicare & Medicaid Services (CMS), Centers for Disease Control and Prevention (CDC), Agency for Healthcare Research and Quality (AHRQ), HealthData.gov, and other government sources. CMS, for example, publishes de-identified public-use files, data tables, dashboards, and other data products.
Choose a dataset based on the population, measures, time period, and level of detail your dashboard requires.
Sources
1. U.S. Department of Health & Human Services. “Summary of the HIPAA Security Rule.” HHS.gov. https://www.hhs.gov/hipaa/for-professionals/security/laws-regulations/index.html
2. U.S. Department of Health & Human Services. “Security Rule Guidance Material.” HHS.gov. https://www.hhs.gov/hipaa/for-professionals/security/guidance/index.html
3. National Institutes of Health: StatPearls. “Health Insurance Portability and Accountability Act (HIPAA) Compliance.” NCBI. https://www.ncbi.nlm.nih.gov/books/NBK500019/
The Secure No-Code & AI Platform
Supercharge your team's operations and performance with better apps and tools.
Create custom apps fast
Secure & HIPAA compliant
Streamline complex workflows

The Secure No-Code Platform
Build apps with best-in-class security.
Related Articles
Discover related guides on healthcare no-code development, HIPAA compliance, security, integrations, and launching apps faster.
.png)
10 Best Replit Alternatives: Tested for Developer Tasks (2026)
After comparing 10 Replit alternatives, I found differences in compliance features and needed coding skills. Discover platforms and prices to find the best fit.
%20(1).png)
8 Healthcare Dashboard Examples (2026)
Explore healthcare dashboard examples for hospital operations, revenue, and compliance. Discover what each dashboard tracks and how to build one.
10 Best HIPAA-Compliant Telehealth Platforms and Features | 2026
HIPAA-compliant telehealth platforms provide secure medical visits. Top platforms are Doxy.me and Zoom for Healthcare. Compare tools and learn your best fit.